AutoMarkings Plugin for Flot
This is a plugin for drawing markers for minimum/maximum range and average values of series with flot.
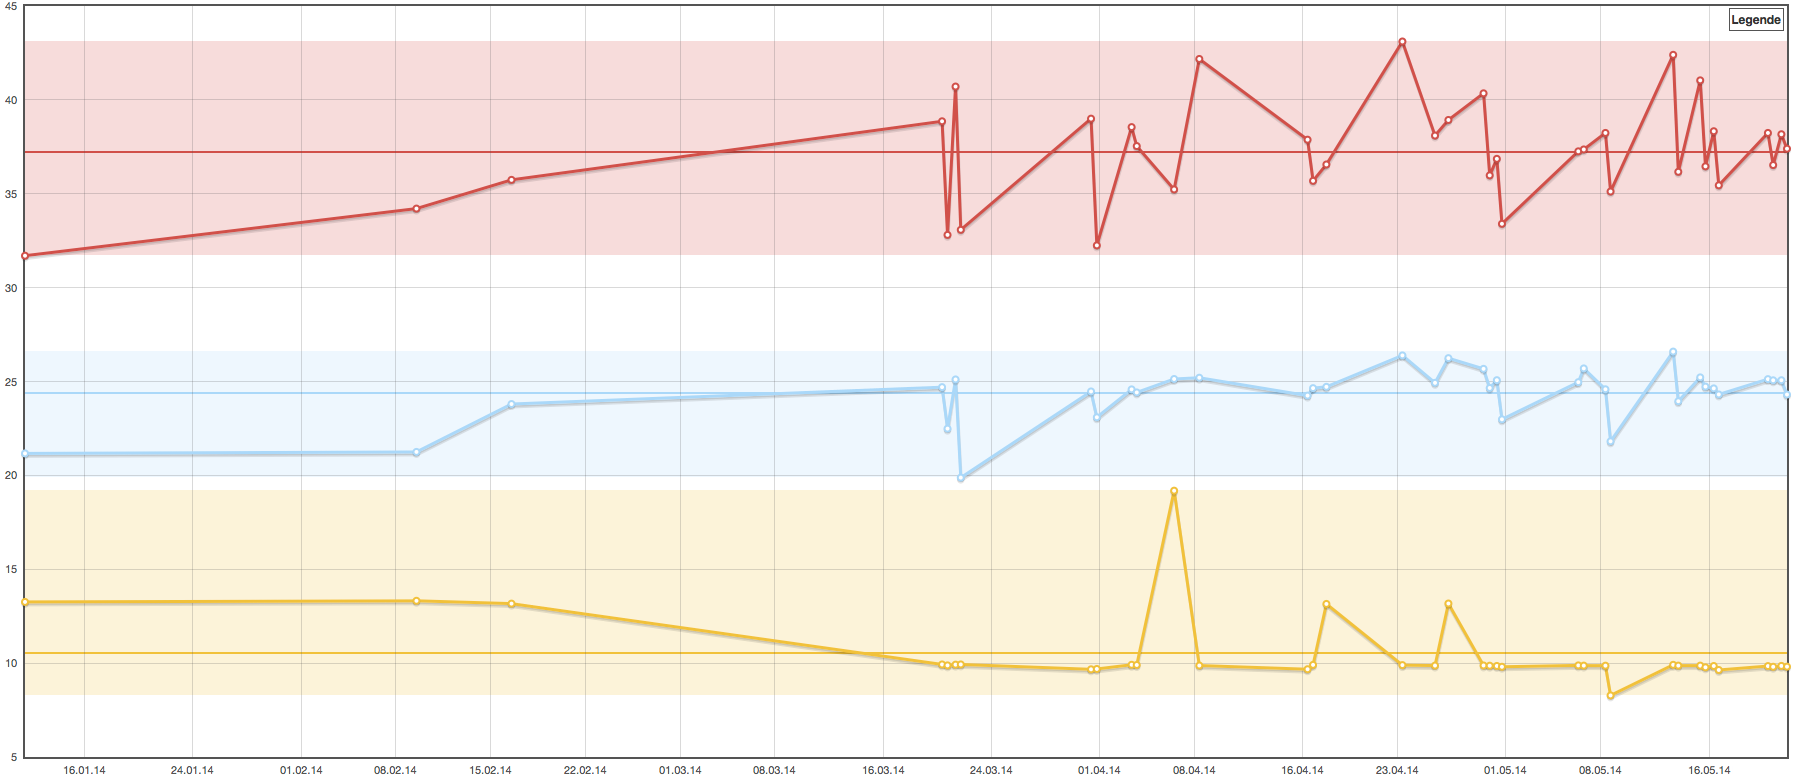
Example
Installation
Download and include the javaScript-file on your page:
<script type="text/javascript" src="[...]/jquery.flot.min.js"></script>
<script type="text/javascript" src="[...]/jquery.flot.autoMarkings.js"></script>
Options
Options can be set inside the 'series' option of the plot. Flot will then copy these to each series.
var options = {
  series: {
    autoMarkings: {
      enabled: true,
        showMinMax: true,
        showAvg: true
    }
  }
};

$.plot(placeholder, data, options);
Options can also be set for each series individually to e.g. enable autoMarkings on one series and disable on another.
enabled
Enable or disable autoMarkings.
Value: true or false
Default: false
color
Color to use for drawing the marking of the series. If not given the plugin will use the color calculated by flot for each series.
Value: [String] e.g. "rgb(237,194,64)"]
avgcolor
Color to use for drawing the average line of the series. If not given the plugin will use the color calculated by flot for each series.
Value: [String] e.g. "rgb(237,194,64)"]
showMinMax
Draw a marking between the minimum and maximum of the series data.
Value: true or false
Default: false
minMaxAlpha
Alpha value of minMax markings color.
Value: double
Default: 0.2
showAvg
Draw a marking line for the average of the series data.
Value: true or false
Default: false
min
The minimum value of the series data. If not given the plugin will automatically calculate this value.
Value: [double]
max
The maximum value of the series data. If not given the plugin will automatically calculate this value.
Value: [double]
avg
The average value of the series data. If not given the plugin will automatically calculate this value.
Value: [double]
lineWidth
The lineWidth for the average value lines and other markers.
Value: [int]
Default: 2